
Movie mode
Straight forward through your data
Quite often, it is already helpful to be able to jump back and forth between neighboring images without the usual reorientation - giving the opportunity to observe structures emerging, moving and vanishing along the stack.
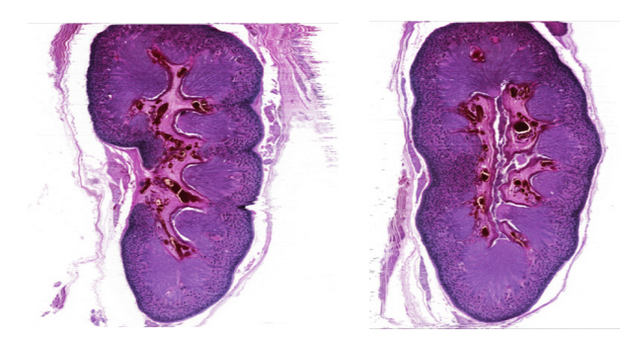
Virtual Slice Images
Different orientation? No problem!
Use reslicing of the 3D data set to generate virtual histology sections(*). What if the specimen had been sliced in a different direction? Give your students the possibility to see how fiber bundles look like when sliced in different ways - it will for sure help to improve their understanding!
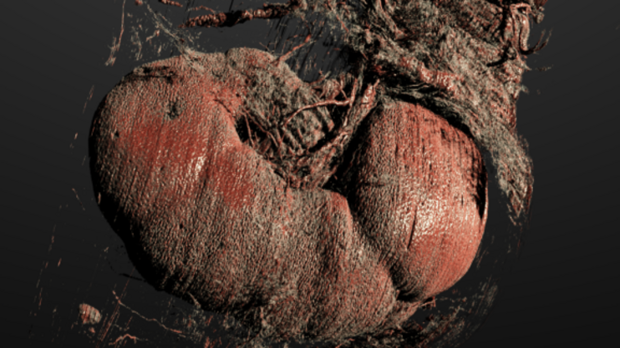
Volume rendering
Going 3D
Use a volume renderer of your choice to visualize the 3-D data set. Based on gray-level images - which are part of our scope of delivery - you can generate 3-D views of your data set. Use Look-Up-Tables (LUTs) to focus on different structures of your data set, and boost your understanding of the spatial relations of structures in your data.
For the volume renderings we provide, we typically use so-called physically based rendering techniques, resulting in stunning, photorealistic images.
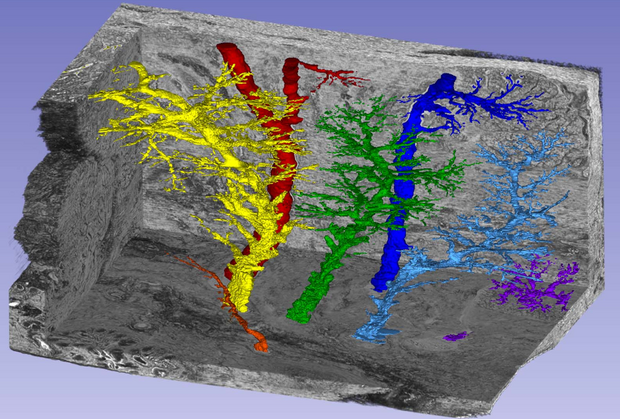
Structure Segmentation
Would you like to cut out a structure from your tissue sample and visualise it separately? From simple colour-based approaches to AI-supported manual segmentation, we will find the right approach for your data.